

Introduction:
A little less than three years ago, the founder of crossresults.com, Colin Reuter, tweeted to Cyclocross Magazine something along the lines of: Can you do something sciency on the different rolling resistances of cyclocross treads?
Being a cocky newbie editor at the time, I fired back: “Challenge extended, Challenge accepted” (pun intended). I didn’t have a great idea of how I was going to accomplish this goal, but I knew it was something interesting and worth doing. After later inquiry, Colin wanted to know the differences between file treads and the treads of common "all-arounder" tires at different pressures. I think that most cyclocross racers have a good gut feeling about how certain treads slow them down on a flat stretch of the course, but having quantifiable numbers might impact the decision making process before the season begins and we load up on different types of tires. So even though I am no longer the editor at Cyclocross Magazine, I still wanted to create a test all of these years later.
There are sophisticated websites out there, such as BicycleRollingResistance.com, that solely focus on the rolling resistance of tires. Like much of the cycling world, they extensively test road and mountain equipment and screw everything cyclocross, which means there is a vacuum here for some needed data. However, they have sophisticated equipment and a temperature controlled lab, and I don’t. On the flip side, their testing is limited to simulating the road, while I have slightly more versatility.
For a common test at other websites, they hook up a wheel to a smooth drum, and with an electric motor, they turn the tire on a wheel until it gets the drum up to a rotational speed of 18MPH, and then calculate how many watts it takes to keep it at that rotation for 30 seconds.
Due to lack of that equipment, I was forced to take the opposite approach: ride at a consistent power, and measure the speed differences each tubular tread has. My way has loads more variables and room for error, so unfortunately, I had to do a lot more tests than just three 30 second run-throughs before I got comfortable enough with the results (sure this is faux science, but there’s no need for me to be sloppy about it if I can avoid it). At the very bottom of this article, I go in to boring length about all of the methodology of this test, but there some major disclaimers I want to get off my chest for all readers before I talk about my findings:
1) The conditions I tested were limited, and are not close to representative of all the features you can find on a cyclocross course. While I would love to test the differences of tread in gravel, sand, mud, snow, and rooty paths, I am not confident in anyone’s ability to consistently ride near same power to collect speed data in those conditions. I tested these tires in two separate conditions: on pavement (that you’ll likely only encounter at the start and finish) and on beaten down grass (that you’ll likely find dominating a local, non-UCI race).
2) I wanted to test a file tread, a chevron tread, and a mud tread. While I used each one of these, my tire choices added in variables that really devastate the goals of the scientific method. I used Challenge Chicanes for file tread, Challenge Grifos for chevron tread, and Clement PDX for mud tread. Using the same manufacturer across the board would have been ideal, but the fact that I used two tires with cotton casings and one with pre-coated sidewalls hurts even more, and created an interesting result that you’ll see below that I can only guess the reasons for instead of conclude with more confidence.
3) I didn’t measure acceleration or cornering speed, two of the most vital parts of cyclocross. All of those rolling resistance articles you’ll find out there for time trials and triathlon tires make sense since those races by-in-large feature constant momentum. Similarly, I only collected speed data when my power was consistent, but unless you are racing on the most boring cyclocross course on earth, this data isn’t directly translatable to the punch and go of racing. In fact, if a course is nothing but winding corners, I would much rather have a tire with plenty of grip that can hold a corner the best and maximize a high wattage acceleration right after.
Findings:
Below is the averages of the three tires on pavement, both at 17PSI and 24PSI:
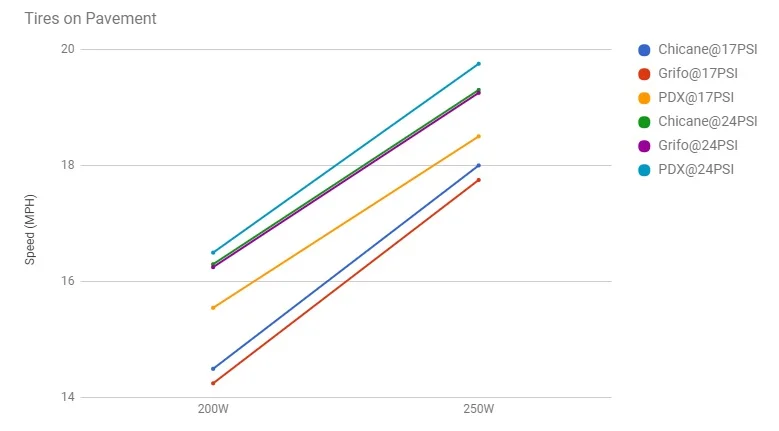
See anything interesting here? We’ll get to the results of the PDX tires later on. But for now, I want to focus on the groupings of the results.
For starters, these results show that pressure, not tread selection, has one of the biggest impacts of efficient rolling resistance. I chose to test at 17PSI (1.17 Bar) and 24PSI (1.65 Bar), mainly because the former is the lowest I will run at a race, and the latter is a pretty common pressure for me when I see roots or a rough transisiton to pavement on the course. That 7PSI might sound paltry, but it makes an enormous impact. The least efficient tread on pavement at 24PSI still outperforms the most efficient tread at 17PSI.
When comparing each tire to itself at the different pressures, we are talking about a full difference of two miles per hour, with the higher pressure offering the higher average speed for the same amount of effort. Compare that to the difference of the Grifos and the Chicanes at the same pressure. At 24PSI, those two tires are less than a tenth of a mile per hour apart from each other, which might be close enough to be considered negligible considering I was measuring speed by GPS.
How would these differences in speed play out in a cyclocross race? Well, let’s pretend that you have an identical rider that could handle a cyclocross course the same way at different pressures (not a big stretch, since this would be an insanely boring paved course with no drafting allowed). A rider on Chicanes at 24PSI would almost certainly lap the identical rider who has Chicanes at 17PSI if we assume a two to two-and-a-half mile course. By comparison, we have two identical riders, one on Chicanes, and the other on Grifos, running the same tire pressure. During this race, the one on the Grifo would likely still be within eyesight of the counterpart on Chicanes at the end of the race.
That’s a huge difference, and one that shows that we might be better off not being so finicky about our tire choice, and a hell of a lot more picky about our tire pressure.
Still, although it is much easier to gather data in a flat, long parking lot, a full cyclocross course on pavement isn’t even applicable to actual cross racing, which is why I made sure to test the treads in at least one more applicable setting: the beaten down grass course. You can skip down to that section below. Otherwise, directly below are my observations about the strange data gathered form the average speed of the Clement PDX tires.
When I first looked at the first set of files, I assumed that I made a mistake in matching the tires to each recording, and I was ready to toss all of that data out as an outlier or a really stupid slip-up until I realized that the tests on the other days were giving me similar averages.
Inexplicably, the Clement PDX mudder is more efficient on pavement than the Grifo or the Chicane. The difference is noticeable at 24PSI and strikingly obvious at 17PSI. My assumption from years of racing was that the tread pattern on a mud tire was far slower on pavement. If I had caught this on the first round of data collecting, I think I would have immediately went out and got a pair of Limus tires (a cotton casing mud tire), because I would have been interested to see if the speed on those tires were similar to those of the PDX tread. Unfortunately, since I waited until after all my testing was done to look at any of the data like a chump, I am limited at some of the conclusions I can confidently make about this result.
So here are some of the possibilities I am considering of why the PDX rolls faster than others at sub-25PSI inflation levels:
1) The contact patch of the mud tread, while clunky on pavement, is still much smaller in overall surface area than a chevron or a file tread WHEN THE INFLATION IS LOW. This option makes sense when you think about treads on a hard surface like ice, where a mud tire has little traction while a file tread can grip ice much better (due to both the larger contact patch and the way file treads can hold onto ice). If this was the correct reason, my guess is that if I blasted both the Chicanes and the PDX tires to 65-75PSI, the file treads would overtake the mudders in terms of efficient rolling resistance. It also stands to reason that it wouldn’t matter if I was using PDXs or Limus tires if this possibility held true.
2) The Clement tread and pre-coated casing is more efficient than cotton casing on a smooth surface. My testing ground was an Elementary school parking lot that had been paved over less than a month ago, so it was about as crack-less as you can get. My assumption is that a cotton casing would deform more efficiently to any surface, including a flat surface, than pre-coated sidewalls, but if this possibility were true, it could once again turn my assumption on its head.
3) This is not one I’m actually considering, but weight of the tire could be another factor in a different test like this. As I’ve written before, weight distribution at the outside (rather than the inside) of a rotational object provides more efficient momentum once an object gets up to speed (it is also slower to accelerate to that speed). My problem with using this as my explanation is that the listed weight of PDX is noticeably less than that of both of the Challenge tires I tested.
Again, if you have any ideas as well, I’d be happy to hear them. I’m fully aware that I’m not in an enclosed laboratory setting with the same sophisticated machines that you see testing rolling resistance on road tires. I would love for you to see my methodology at the bottom and see if there is something I’ve seriously overlooked.
Does that mean everyone should run out, buy a bunch of mud tires, and blast them up at high PSI? Not at all. As I already said, while there is pavement on most cyclocross courses, it is such a small part. So before we jump to any more conclusions, let’s take a look at some of the data from the beaten down grass.
Below is the averages of the three tires on grass, both at 17PSI and 24PSI:

Thankfully I have a nearby park where Kate and I also host a weekly cyclocross practice, so we have already burned in a nice flat section where the grass is seriously beaten down (it would make no sense to ride along fresh grass since the tire that gets tested last would get to deal with the least resistance during every day of testing as you wear down the grass).
The results here are almost identical to what I expected in both cases before I started any testing to begin with. The first thing that should almost immediately jump out here is how much different the PDX is compared to its performance on pavement. While it rolled well when the ground had almost zero give, it is a slogger off-road, even on a really well burned in course.
Especially take a look at it at low pressure. It looks a little bit more drastic than it actually is because the Y-Axis is a little tighter than in the pavement graph before. Still, that PDX is nearly a full mile per hour slower than the two Challenge tires when all are running 17PSI, which amounts to around a half of a lap extra when considering our identical rider scenario for a sixty minute race on your standard length UCI course.
Again, I know I can’t accurately measure the performance of these tires in other conditions, not even by the faux science standards I’m using for this test, so I won’t even try to create a test for the mud. Unfortunately, that means that this test is really geared towards the file treads. Still, it doesn’t take a wannabe Bill Nye to tell you that file treads pick up peanut butter mud while a mud tire like the PDX is designed to shed it off the rubber.
However, this test does reveal how your race might be impacted if you decided to exclusively use a mud tire for the full length of your season.
On the other hand, there is a strikingly similar result from the pavement test. All of the tires moved at a higher speed at the same force when pumped up to 24PSI. The PDX, on average, still performed much better at 24PSI than the Chicane did at 17PSI. The PDX also got pretty close to the Grifo’s speed at the same pressure when a little more power was applied to both tires.
Conclusions:
So my fear is that after reading this, a few people will look at this and think they are justified in buying loads of file treads and pumping them up to 24PSI and above, because according to the data, they will be a whopping 0.3 MPH faster than the next best thing.
If cyclocross was a matter of riding a bike in a straight line on grass, that conclusion might be great. Hell, you might even want to try a Challenge Paris Roubaix Tire and pump that baby up to 120PSI if that was the case.
Unfortunately for data (or at least our current ability to measure data), there is still very much an art to cyclocross. While one tire might give you little rolling resistance in the back straightaway of a course, it also might have little traction in a corner, or a weak ability of transferring power to the grass while accelerating out of a corner.
And it bears repeating, yet again, that this test heavily favors a file tread. Each tread has its own strength: mud for mud (and apparently pavement?); file tread for snow, ice, grass, and sand; and chevron for loose dirt, grit, and gravel. Being lucky enough to race on the UCI scene on the East Coast, Kate and I are able to experience all of these different kinds of conditions, and I think I would still stubbornly prefer to stick with the treads I am used to for each course even though this data suggests that some treads are pretty darn close to others overall.
For those riders out there that stay local, and have a similar course type, I think there is a bigger takeaway from this data. If you don’t have loads to spend on different wheelsets, at least invest in an accurate pressure gauge and start testing corners and speeds for yourself.
If you live in an area where you know you’ll at least have one muddy race, you shouldn’t feel like the rest of your season is in shambles if you have to use a mud tire for everything. In fact, there might be a good segment of a race where you are fighting against the same resistance as the guy or gal next to you running a chevron tread. You should certainly be feeling great if you see your nearest competitor pumping his or her tire without a gauge.
As for my own racing, I realized that I am usually prone to finding where I bottom out on a course during pre-riding, and then adding a touch of air. While I still think this is a pretty good approach, especially for a UCI style race with pro-only sections, there are power-heavy courses I can think of where I could use a little less rolling resistance instead of greater traction.
Below is the methodology I used for creating this test. I was considering starting with it in this article, but it’s probably insanely boring for a vast majority of people. Still, I know there are people who are critical enough of tests who want to know how research was obtained (which is a great trait to have in this day). So the following is for you…
Methodology:
So I’m glad Reuter said sciency rather than science, because you’re insane if you think these tests are just as accurate as road tire tests on websites like Rolling Resistance. Still, I did try and think of loads of variables as best as I could. Due to the nature of these tests, I can’t just throw a Vittoria, Tufo, or Dugast on my wheels and retroactively compare them to my former tests, and you’ll see why here.
First off, my testing was done on the same bike, with the same power meter (an insanely heavy but amazingly consistent InfoCrank), and the same wheelset. Because I had some overwhelming fear that different bearings might put up different resistances (which might have been a case of overthinking since I’ve just installed new Enduro cartridges in most of my wheels for pre-season maintenance), I rode the same wheelset with the tires unglued to the rim.
As you might have guessed, I did the vast majority of the testing on grass first before the pavement (although I showed the results above in reverse). I didn’t want pavement wear on the treads affecting the other tests. Over the course of two weeks, I tested the tires a minimum of three times per pressure and condition, not even bothering to go out on days that the Weather Channel reported wind above 5MPH.
In every test, I had to at least gather data for every tire, knowing that rider weight, clothing, temperature, and ground conditions would vary enough day by day to throw off the data significantly (for instance, if I had decided to only use Grifos one day where the ground was dry and harder, it would give those tires a serious advantage). My largest concern was finding the relative speed of the tires against each other.
The most difficult part of the test was maintaining constant power. I can get pretty consistent (within 2-3 watts on my reading) on a flat stretch of pavement, but beaten park grass took all of my concentration on the power numbers and more tests to get usable data. I had originally intended on also getting data from 300W averages, but I wasn’t able to manage to hit those numbers with any level of consistency on grass. Obviously I didn’t just average the readings of an entire ride, but used Garmin Connect to analyze the speeds in the areas where I hit the longer power plateaus.
While I’m sure there are variables that I overlooked (and would be glad to hear them), I am at least comfortable enough with how the tires performed in relationship to each other to state that pressure is a very large factor, at least when it comes to the grass crits of the cyclocross season, and if you brought two sets of tires with you to a race, you might be better off testing separate pressures on your pre-rides to get your laps dialed in rather than mulling over which tire to use.